Pet Ownership in the United States
by Anna Fleck,
Oct 15, 2024
Data from a Statista Consumer Insights survey reveals that dog ownership varies greatly around the world. Where as many as seven in ten respondents said they had a dog as a pet in Mexico in a survey conducted between July 2023 and June 2024, under three in ten said the same in Sweden.
In the United States, around half of respondents said they owned a dog. Americans were most likely to own a dog, followed by a cat (36 percent), a fish (7 percent), a reptile (4 percent) and a bird (4 percent). Only three percent of respondents said they owned a rodent, whether a rabbit, a hamster, guinea pig, mouse or rat.
 You will find more infographics at Statista
by Martin Armstrong,
Dec 7, 2022
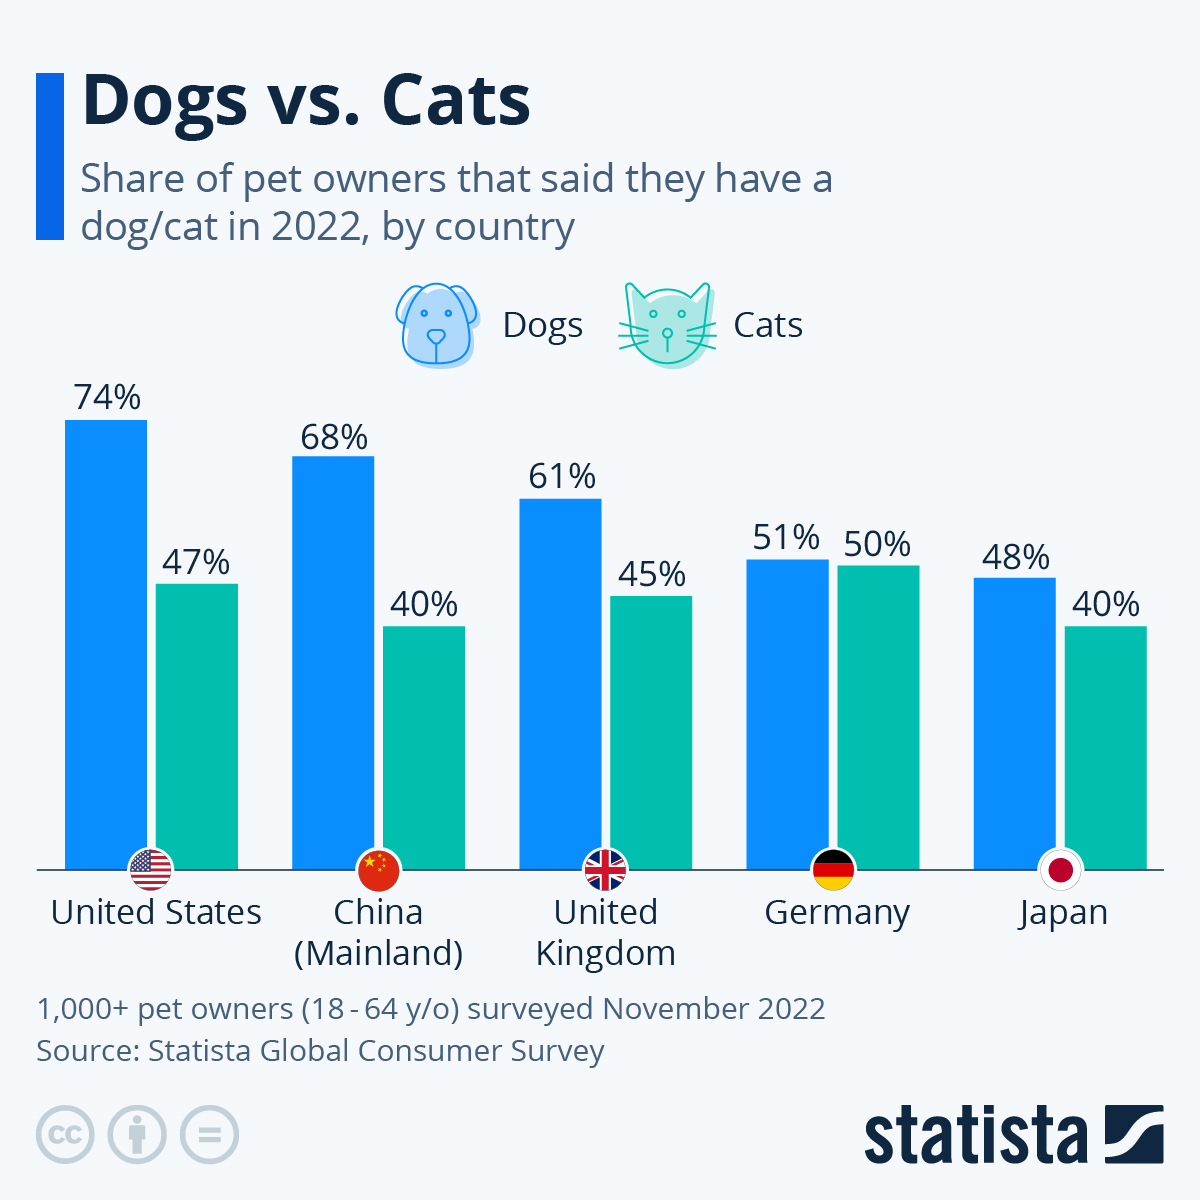
Looking at the internet, you'd probably come to the conclusion that the world's favorite pet is the cat. After all, the world wide web is full of cute and funny videos, gifs and memes of our feline companions. When it comes down to it though, pet owners more often opt to share their lives and homes with 'man's best friend', the dog.
Results from a new edition of the Statista Global Consumer Survey show that at least in the United States, mainland China, the United Kingdom and Japan, dogs have a fairly comfortable lead over their greatest furry rivals. In the U.S., 74 percent of pet owners said they have a dog, compared to just 47 percent with a cat. In Germany though, the fight is far tighter, with dogs just edging out cats on 51 percent compared to 50 percent.
 You will find more infographics at Statista
by Katharina Buchholz,
May 31, 2023
Traditional channels of pet acquisition have nothing on cats - which in a shockingly high number of cases pick their owners rather than being picked out by them. According to a 2022 survey by Statista Consumer Insights, 25 percent of American cat owners said that their feline had wondered in off the street or was taken in as a stray animal that showed up in the neighborhood or even on their new owner's doorstep. The share of stray intake was much lower for dogs at just 5 percent of owners giving this answer to the question of where their newest pet had come from. Among other animals, the share of owners having taken in a stray or street animal was almost as low at 7 percent.
In the case of dogs, getting one from a friend or acquaintance or getting one from a breeder were the most common ways of acquisition. For other animals, including fish, rabbits, birds and reptiles, the pet shop was still where almost half of owners had turned to. While shelter or stray adoption was in the single digits for other pets, another quarter of cat owners and 19 percent of dog owners said they had gone through a shelter to acquire their pet - a higher share than had been to the pet shop. Only 4 percent of cat owners said they had bought their cat from a breeder.
This instance finally speaks to the different cost of animals in the United States. 35 percent of U.S. dog owners said that they had paid more than $250 for their animal, while that number was in the single digits for cats. In fact, 61 percent of cats in the U.S. had been free, according to their owners, as opposed to 33 percent of dogs.
Also according to the survey, half of U.S. pets receive birthday gifts and a quarter of owners are contemplating of giving them a proper animal funeral once the time comes.
 You will find more infographics at Statista