The Cost of Housing in America
by Felix Richter,
Aug 27, 2024
Housing affordability in the United States has taken a sharp turn for the worse in recent years, as house prices surged to historical highs during and after the pandemic and mortgage rates have risen steeply over the past three years, as the Fed tried to rein in inflation.
|
MARKET IMBALANCE DISCUSSION BOX |
|
|
DEMAND |
SUPPLY |
|
cash from government stimulus checks |
very constrained supply of new/ existing homes |
|
stay at home orders and remote work |
construction disrupted by Covid |
|
buying larger cheaper house in different location |
potential sellers afraid of uncertainty |
|
historically low mortgage rates |
|
This imbalance caused a rapid increase in home prices across the country, pushing many potential buyers out of the market, a trend that was exacerbated when the Fed started to tighten its policy stance in March 2022 in its efforts to cool inflation.
|
THE AFFORDABILITY GAP DISCUSSION BOX |
||
|
|
2022 |
2024 |
|
Minimum Income to buy mid-range house |
$380,000 |
$439,170 |
|
Required income to buy mid-range house |
$74,000 |
$120,000 |
|
Medium income |
$74,000 |
$84,000 |
|
|
0 |
$36,000 deficit |
|
National Association of Realtor’s Data Below |
||
Drastic shifts in expensive coastal markets
The most significant affordability shifts are evident in already pricey coastal population hubs. California accounts for the top three markets when it comes to the widening gap between actual incomes and the incomes required to buy a median-priced home.
In the middle of the country, cities that once had a balance between local incomes and housing costs are now struggling with affordability.
Kansas City, MO, known for its robust economy and modest housing costs, has seen earnings go from $14,000 above the minimum required income for a median-priced home to $32,000 below.
Hartford, CT, once had a $16,000 surplus when comparing the median income with the required income for a median-priced home. Now, it's a $28,000 deficit. Incidentally, Hartford is currently the hottest real estate market in America.
It's not so surprising to see Washington, DC, in this category: The nation's capital has seen housing prices soar in recent years.
 You will find more infographics at Statista
by Katharina Buchholz,
Aug 27, 2024
U.S. home sales used follow a cyclical pattern, with most demand and higher prices in summer and less demand and lower prices in winter. However, this dynamic has been somewhat upset since 2020. Since then, home prices have risen much more in-season than they have fallen off-season while the supply of homes for sale became more and more scarce.
According to Marketwatch, the pandemic housing market actually collided with other, longer-term developments that were already putting pressure on the U.S. home market and its housing supply. Mortgage rates that were once again rising slightly were causing more Americans to stay put rather than move. Also, homeowners are older now than they used to be, but are more likely to "age in place" instead of downgrading, snowbirding or moving into retirement communities. The average time between moves had already reached a high of 13.5 years in 2020, increasing from just around ten years in 2012, and only started to fall again in 2021 as the pandemic prompted more moving activity.
 You will find more infographics at Statista
by Felix Richter,
Aug 27, 2024
Americans looking to buy a house are currently facing an almost perfect storm of unfavorable conditions. Not only is it hard to find a home, it is also increasingly hard to afford one. Historically high home prices combined with mortgage rates that have surged from historic mid-pandemic lows to the highest level since the early 2000s are causing major headaches for would-be home buyers.
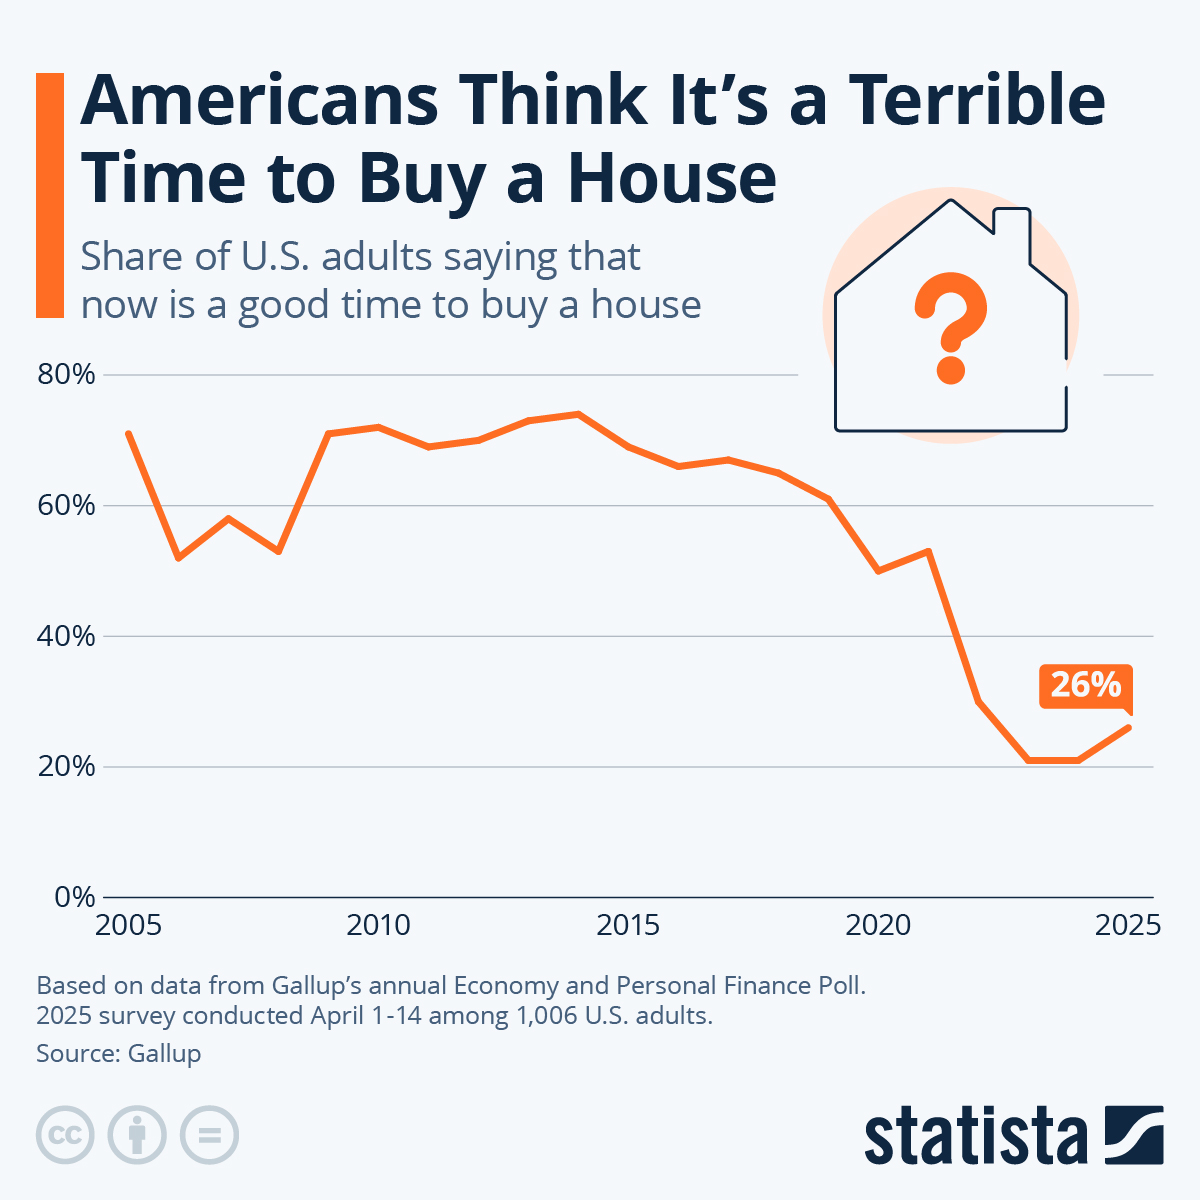
The latest results from Gallup’s annual Economy and Personal Finance poll show that current conditions have really spoiled Americans’ appetite to buy houses. This year’s survey, conducted April 1-22, shows that only 21 percent of U.S. adults think that now is a good time to buy a house – down more than 30 percentage points from 53 percent in 2021 and even further from pre-pandemic levels.
According to Gallup, that’s by far the lowest level of confidence since the question was first asked in 1978. Before 2022, the share of people thinking it was a good time to buy a house had never dropped below 50 percent – not even during or in the aftermath of the 2008 housing crisis.
 You will find more infographics at Statista